Navigating to the video analytics section
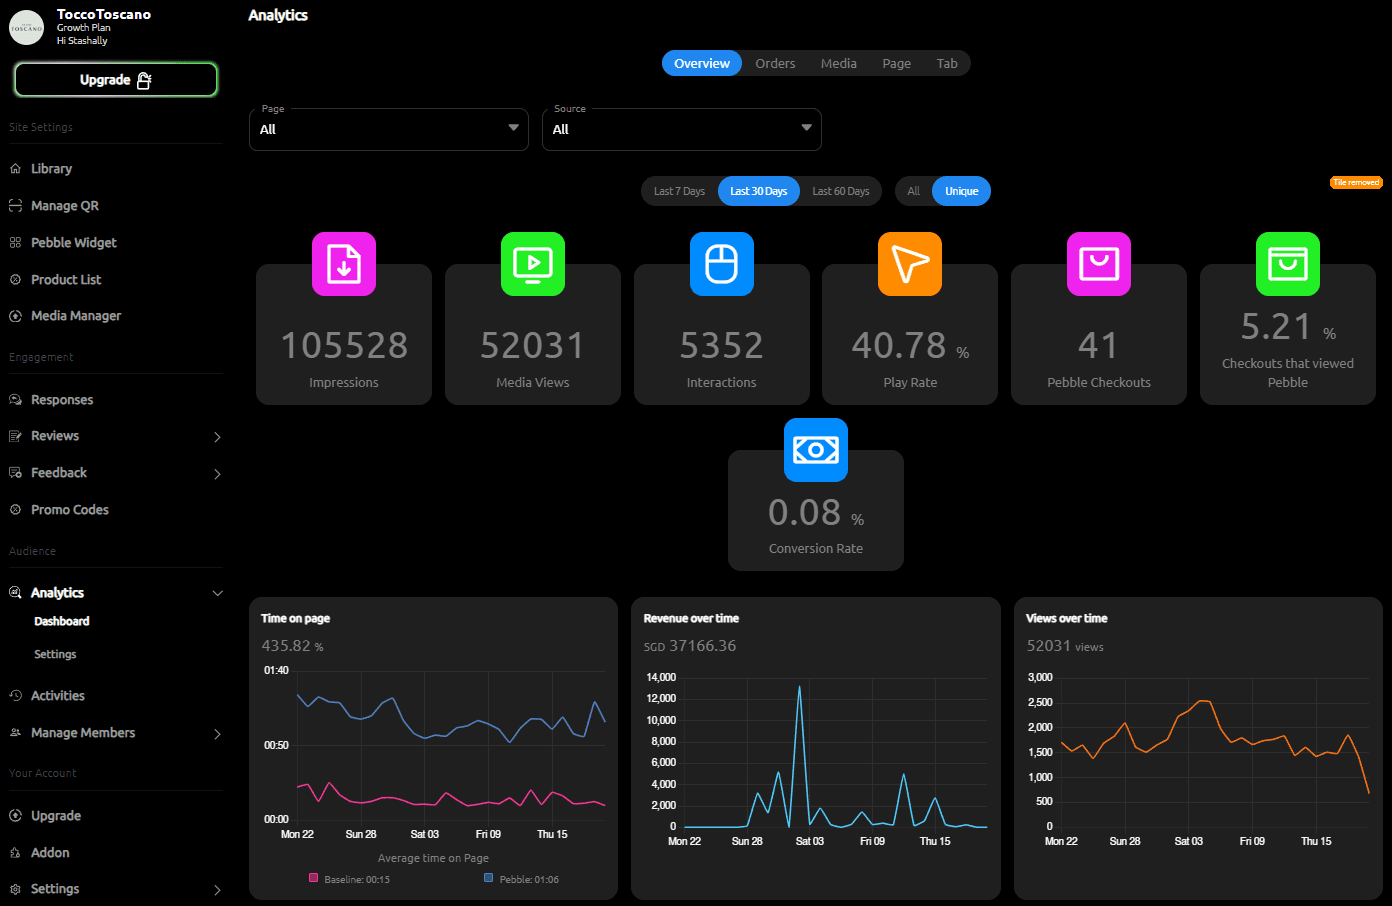
You can find video analytics details on the left navigation bar once you've entered your desired project. From here you can get an overview on video stats and performance. Toggle between different Pebbles, time frames, sort by unique IPs and more.
We're constantly upgrading the dashboard - please contact us directly if you have any questions.
Please note: Conversion tracking is only available for Shopify stores or upon request under our Custom / Enterprise plans.

Note: Installing the Pebble Shopify app here helps us add track additional stats such as conversions and checkouts. Highly recommended if you are using Pebble on your ecommerce storefront.

Filters
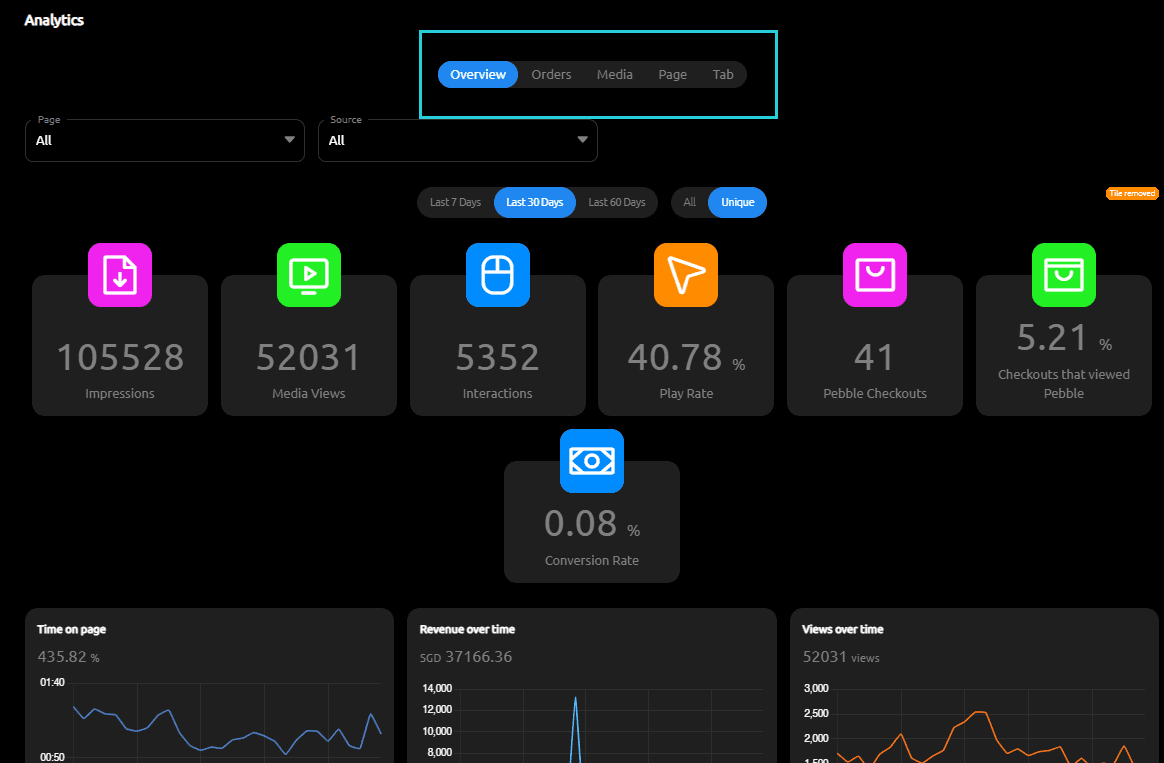
There are various filters you can use to display your analytics,
Overview: Shows you general data from Pebble Videos
Orders: Shows you data that is related to checkouts and conversions
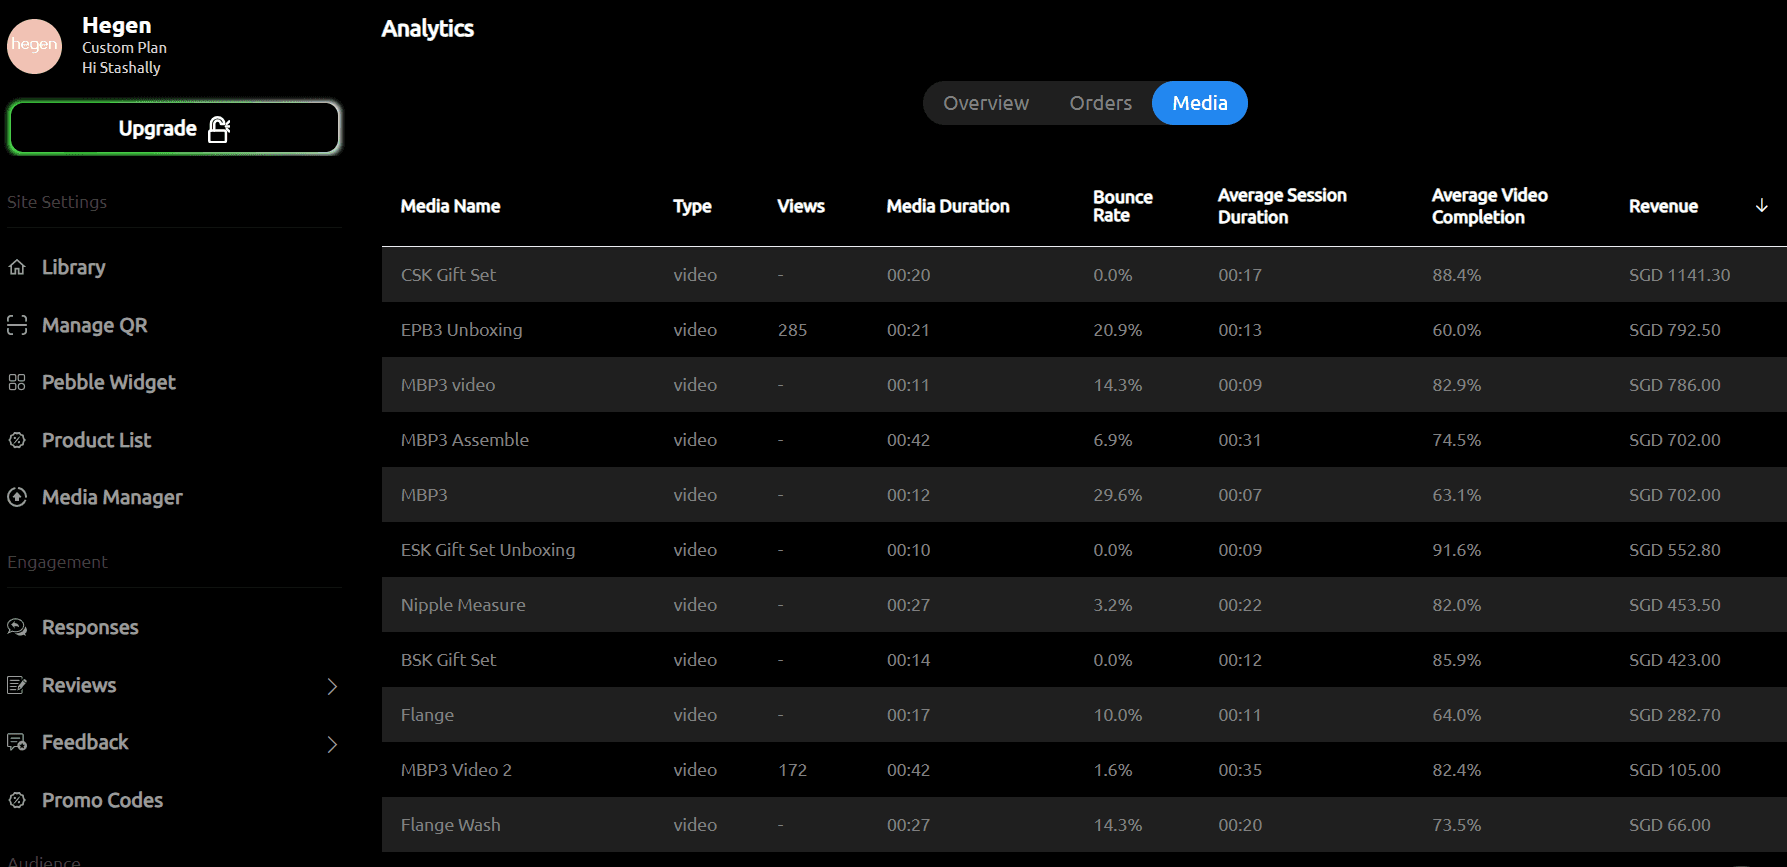
Media: Shows you individual tab/video analytics and best performing media. You can rename media names under 'Media Manager' on the left menu bar. Clicking on the Media Name will play the video.

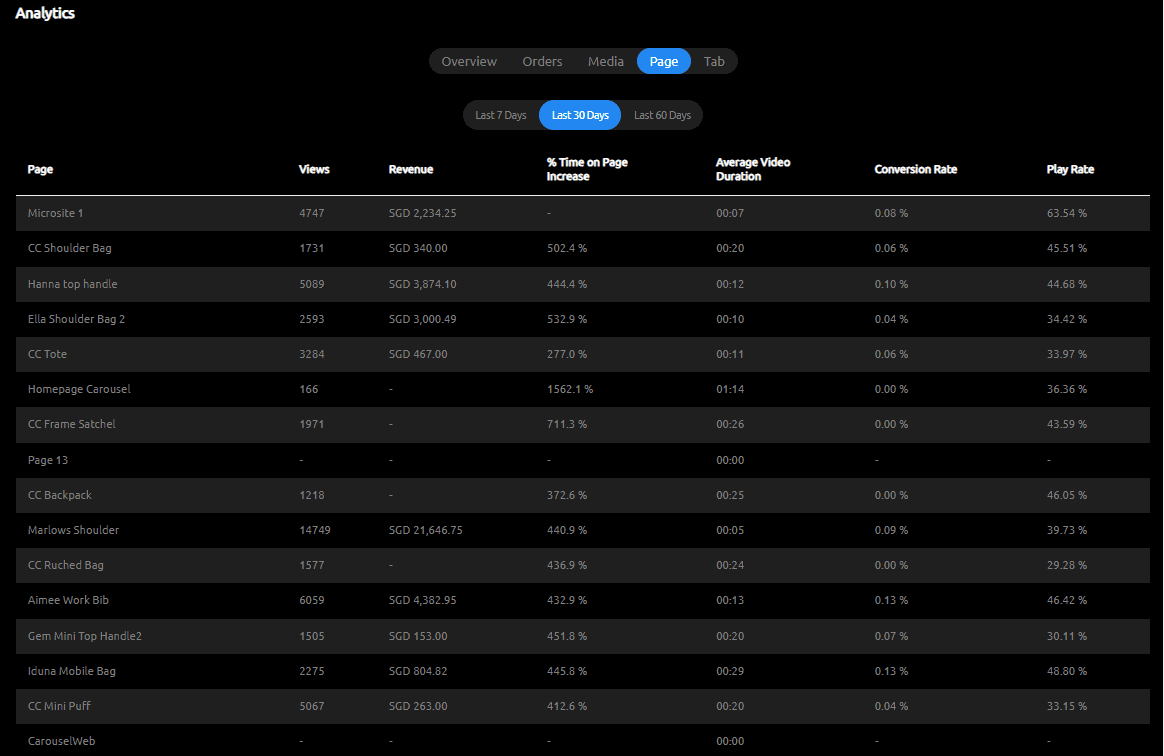
Page: Shows you data related to product pages with time on page increase, average video duration view, and conversion rate.

General Terms
Time Spent on Page: When you install a Pebble embed code on any page, it tracks the session times of all visitors and uses that to create a baseline. From the baseline we are able to derive how effect our videos are in boosting time spent on page. Higher time spent gives higher chance of conversions.
Impressions: This shows the number of times the video embeds was loaded (displayed) but not clicked / played. Usually this number is very close to the number of page visitors.
Media Views: This shows the actual number of times a video was played / clicked and streamed to the customer's device. This accounts for multiple views by the same IP. This does not include thumbnail views.
Play Rate: This shows the percentage of your audience who clicks on a Pebble embed regardless of the number of videos viewed altogether. This will let you know if the thumbnails of the embeds or its placement are attractive. If your Play Rate is low, you can experiment with changing the embed thumbnails border, animation, placement, etc.
Interactions: This shows the number of times a tile component (branching path, shoppable CTA, PDF file download) was clicked within the videos itself.
Pebble Checkouts: This is the number of checkouts that occurred directly after a Pebble video was played.
Conversion Rate: This is the number of Pebble checkouts (conversions) divided by the number of actual real media plays. Essentially the additional conversion rate that Pebble helps boost. Please take note ecommerce stores have an average of 1-3% conversion rate.
Checkouts that Viewed Pebble: This rate is the number of Pebble checkouts (conversions) divided by the total number of checkouts in store, regardless if you have embed Pebble on the page or not. This number is available only with the Shopify app installed and is not applicable unless you have added Pebble videos to the majority of your product pages.
Note: We are constantly upgrading and updating the analytics dashboard to make it better - for suggestions and questions please contact us.
Navigating to the video analytics section
You can find video analytics details on the left navigation bar once you've entered your desired project. From here you can get an overview on video stats and performance. Toggle between different Pebbles, time frames, sort by unique IPs and more.
We're constantly upgrading the dashboard - please contact us directly if you have any questions.
Please note: Conversion tracking is only available for Shopify stores or upon request under our Custom / Enterprise plans.

Note: Installing the Pebble Shopify app here helps us add track additional stats such as conversions and checkouts. Highly recommended if you are using Pebble on your ecommerce storefront.

Filters
There are various filters you can use to display your analytics,
Overview: Shows you general data from Pebble Videos
Orders: Shows you data that is related to checkouts and conversions
Media: Shows you individual tab/video analytics and best performing media. You can rename media names under 'Media Manager' on the left menu bar. Clicking on the Media Name will play the video.

Page: Shows you data related to product pages with time on page increase, average video duration view, and conversion rate.

General Terms
Time Spent on Page: When you install a Pebble embed code on any page, it tracks the session times of all visitors and uses that to create a baseline. From the baseline we are able to derive how effect our videos are in boosting time spent on page. Higher time spent gives higher chance of conversions.
Impressions: This shows the number of times the video embeds was loaded (displayed) but not clicked / played. Usually this number is very close to the number of page visitors.
Media Views: This shows the actual number of times a video was played / clicked and streamed to the customer's device. This accounts for multiple views by the same IP. This does not include thumbnail views.
Play Rate: This shows the percentage of your audience who clicks on a Pebble embed regardless of the number of videos viewed altogether. This will let you know if the thumbnails of the embeds or its placement are attractive. If your Play Rate is low, you can experiment with changing the embed thumbnails border, animation, placement, etc.
Interactions: This shows the number of times a tile component (branching path, shoppable CTA, PDF file download) was clicked within the videos itself.
Pebble Checkouts: This is the number of checkouts that occurred directly after a Pebble video was played.
Conversion Rate: This is the number of Pebble checkouts (conversions) divided by the number of actual real media plays. Essentially the additional conversion rate that Pebble helps boost. Please take note ecommerce stores have an average of 1-3% conversion rate.
Checkouts that Viewed Pebble: This rate is the number of Pebble checkouts (conversions) divided by the total number of checkouts in store, regardless if you have embed Pebble on the page or not. This number is available only with the Shopify app installed and is not applicable unless you have added Pebble videos to the majority of your product pages.
Note: We are constantly upgrading and updating the analytics dashboard to make it better - for suggestions and questions please contact us.